The third of these tabs is for Users, which displays a list of users associated with that institution, alongside graphic visualizations of registrations and user information.
The main users table includes 4 columns:
- User - Includes the user's full name, e-mail address and either a) a message stating they have never logged in to the BetterMynd platform or b) the date they last logged in to the platform.
- Allowance - Displays the number of credits that the institution has made available to the user.
- Used - Displays the number of credits that have been used by a user.
- Remaining - Displays the number of credits currently remaining for use.
Administrators are able to search by name/email, determine the list sort order and filter by Individual or Wellbeing Workshops (this will determine the values for the Allowance, Used and Remaining columns).
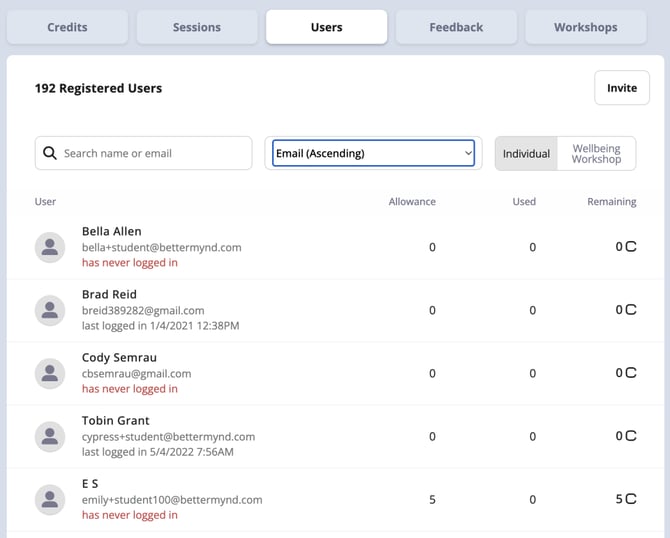

Administrators have the ability to invite individual users to the platform, which can be done regardless of whether a campus is set up as Open Access or Referral. When inviting a user to the platform, an Admin will need to provide the following information:
- User Email Address
- First Name
- Last Name
- Individual Allowances
- Wellbeing Workshop Allowances
- Custom Message (Optional)

On an individual user basis, Administrators are able to update the credit allowances for both individual sessions and wellbeing workshops. To open the edit modal, they can click anywhere on the appropriate row within the Users table. Within the Edit Credits modal, adjustments can be made to both the individual credit and wellbeing workshop allowances. Those changes will be immediately reflected in the user table after clicking Confirm.
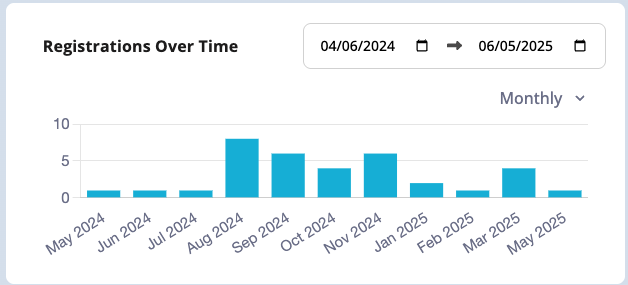
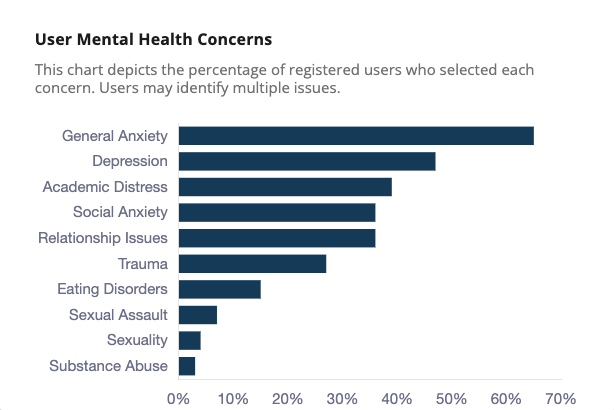
The Users view features 3 separate visualizations, which display user registrations over time, a % breakdown of self-reported mental health concerns, and demographic information. Each visualization can be filtered by user tag - any selected filters will apply to all 3 graphs.